
Work · Product platform
An inspection platform for physical infrastructure
If you're responsible for inspecting a lot of physical kit spread across sites, it usually means clipboards, spreadsheets, and PDFs that are out of date the moment you save them. InfraTrack pulls all of that into one place: every asset on a map, a QR code stuck on the asset itself, and inspections that turn straight into reports.
- Next.js
- TypeScript
- Supabase
- PostgreSQL
- Google Maps
- PDF generation
- Docker
- Sentry
The problem
The people who look after physical infrastructure usually run their inspections on paper or in spreadsheets. The asset records sit in one place, the inspection history in another, and nothing really ties the thing in the field to its paperwork. So inspections slip through the cracks, follow-up jobs get forgotten, and putting a report together is a manual slog.
What we built
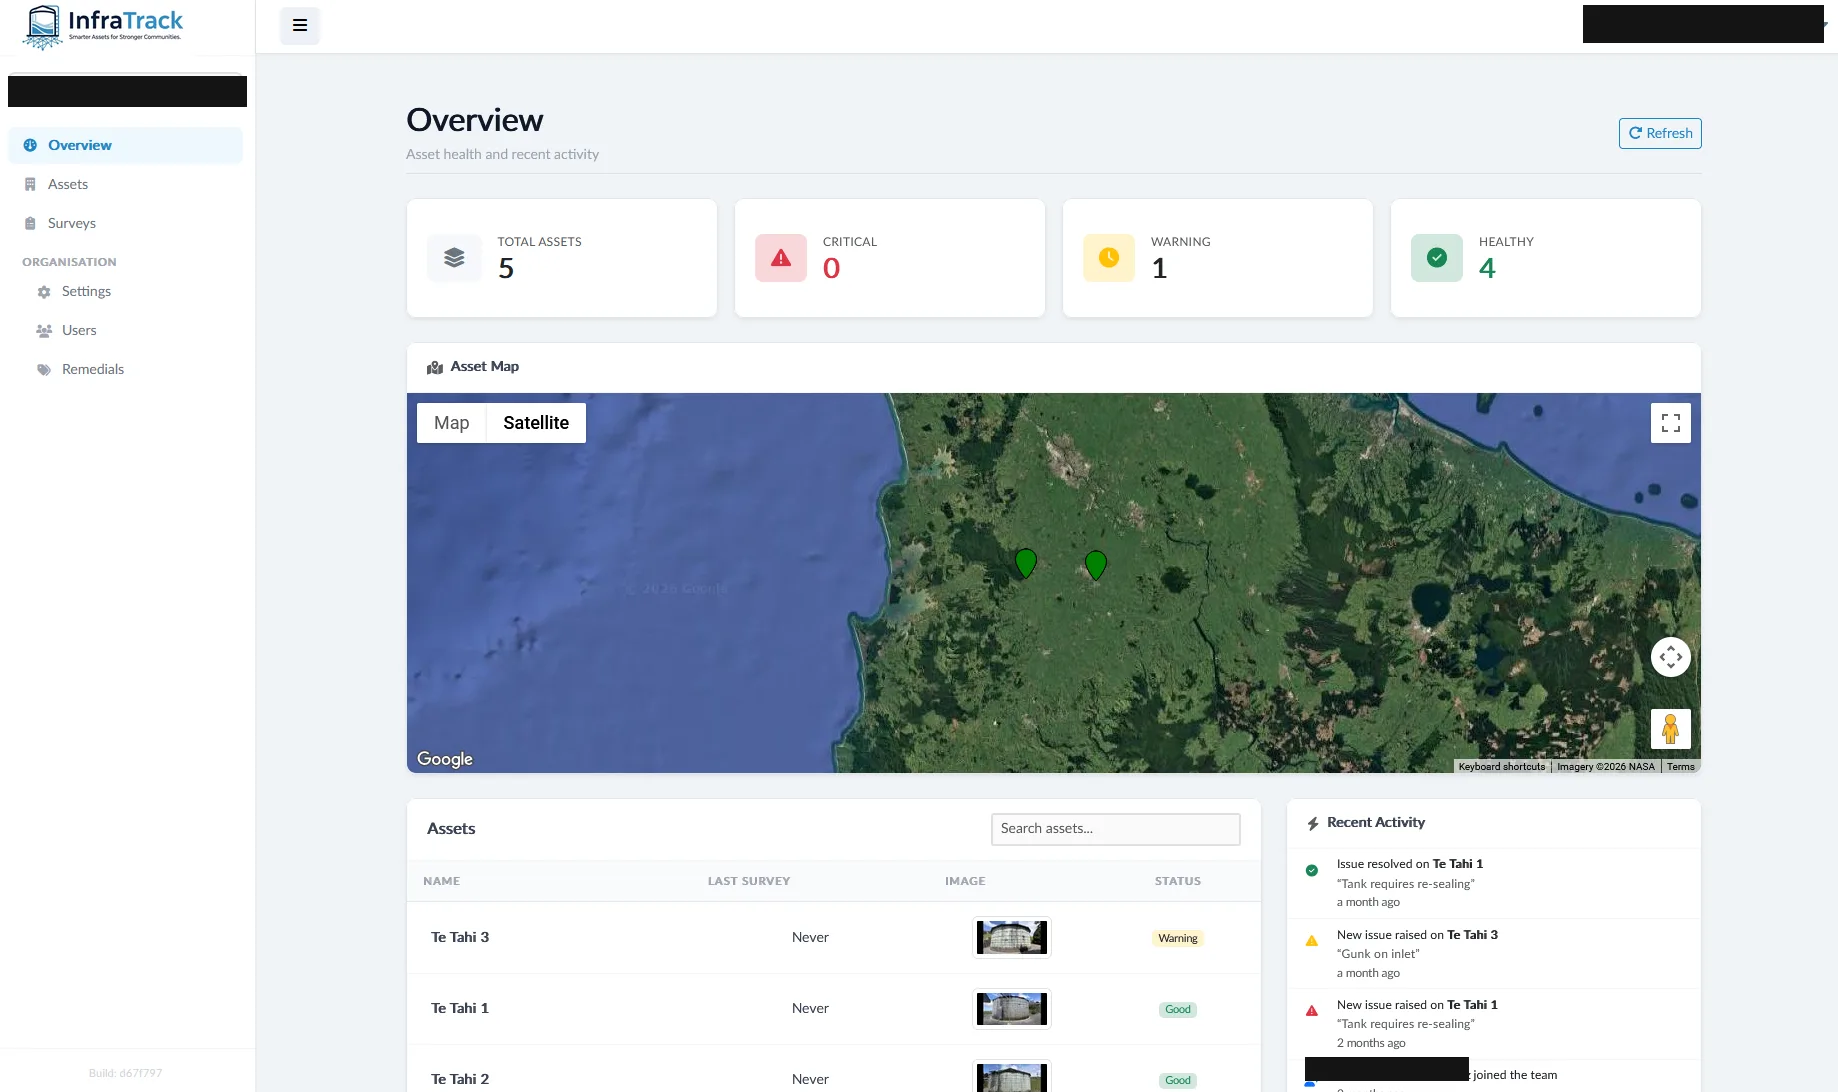
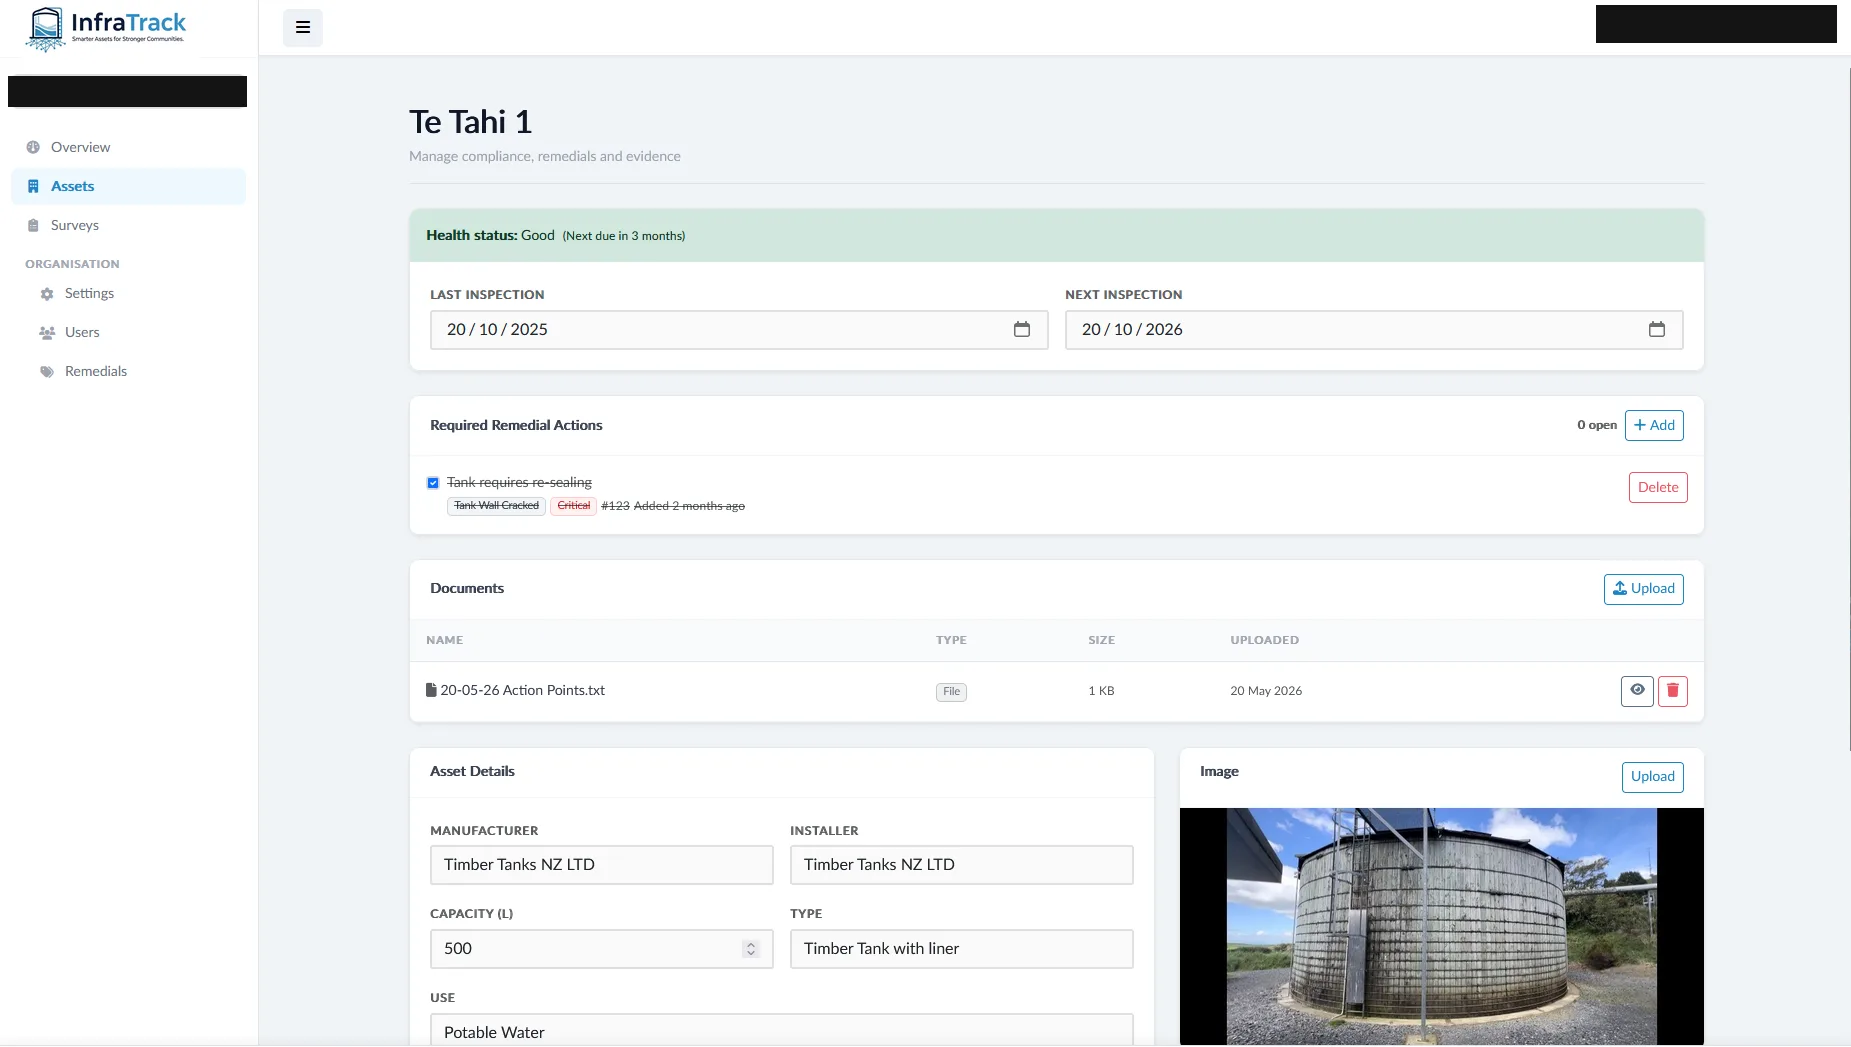
At the heart of it is an asset register — every asset with its location, make, capacity, and inspection history, all shown on a map. Each asset gets a QR code. Scan it out in the field and the right inspection opens for the right asset, with no hunting around and no login to deal with. Inspectors get in through secure links that expire, so they don't need an account just to do their job.
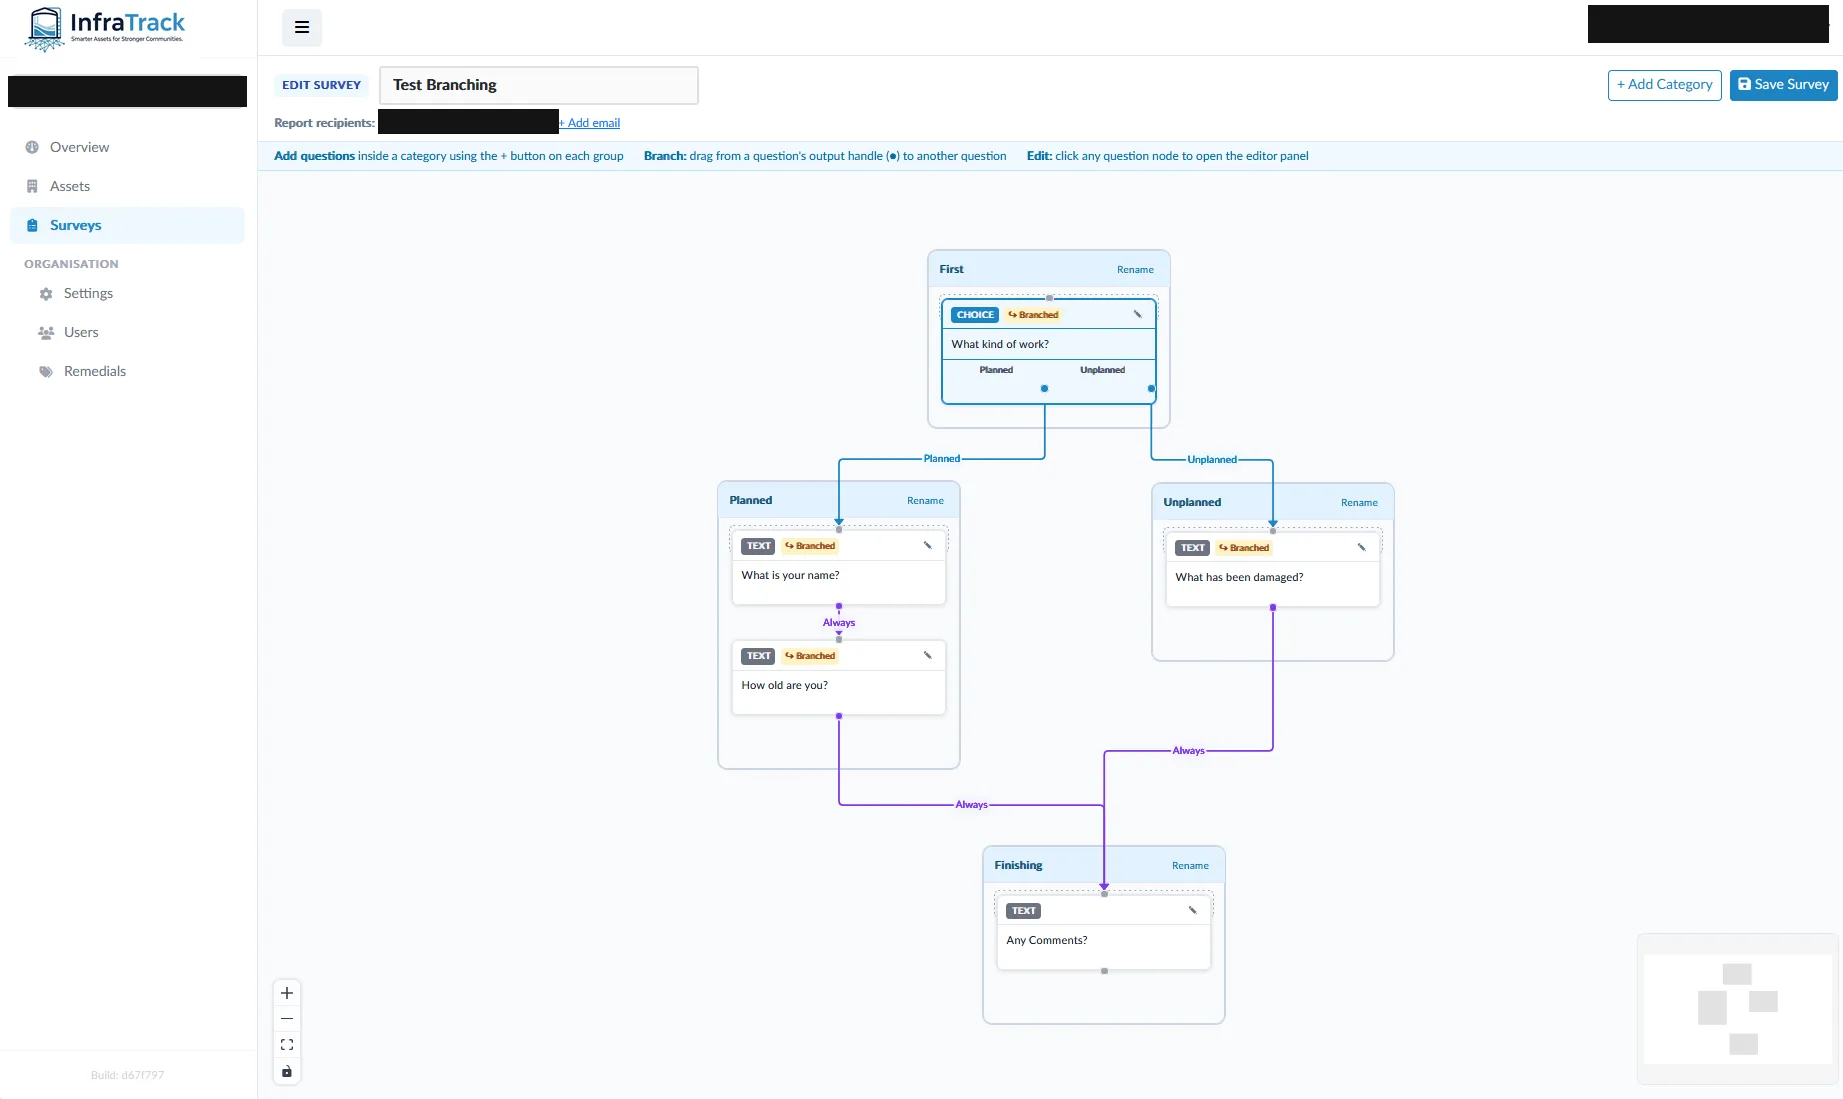
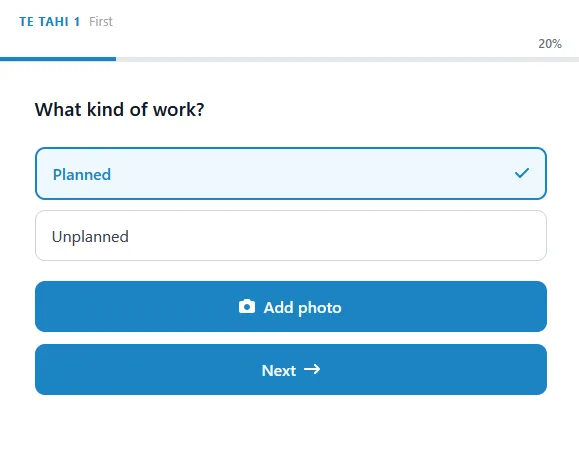
The inspections themselves are built in a drag-and-drop editor, and they branch: the answer to one question decides what gets asked next, so a failed check digs into the detail while a pass just moves on. Inspectors take photos on their phone as they go.
Once an inspection's done, InfraTrack builds the report and emails it to whoever needs it. Anything that gets flagged turns into a follow-up job that's tracked until it's sorted, and the whole lot exports to Excel.
The tricky parts
A lot of the build was shaped by the fact that several organisations share the platform, each with their own assets, surveys, and users, walled off from each other. The public inspection links were the fiddly bit. They had to be dead simple for someone standing out in a paddock, but still secure, still expire, and still be easy to shut off.
It's a good example of what actually taking something to production involves. Not just the features, but the error monitoring, a clean way to deploy it, and the boring-but-important data model that makes sure a QR code on a tank always opens the right survey.
Got something like this in mind?
Describe your project and get a rough sense of size and timeline in about three minutes. Or read our guide to what custom software costs in NZ.
Start a project